|
GREENHOUSE GASES
|
||||||||||||||||||||||||||||||||||||||||||||||||||||||||||||||||||||||||
|
Greenhouse gases are components of the atmosphere that contribute to the Greenhouse effect. Some greenhouse gases occur naturally in the atmosphere, while others result from human activities such as the burning of fossil fuels such as coal, oil, petrol and diesel. Greenhouse gases include water vapor, carbon dioxide, methane, nitrous oxide, and ozone. They are held to be responsible for climate change.
The "Greenhouse effect"
When sunlight reaches the surface of the Earth, some of it is absorbed and warms the Earth. Because the Earth's surface is much cooler than the sun, it radiates energy at much longer wavelengths than does the sun. The atmosphere absorbs these longer wavelengths more effectively than it does the shorter wavelengths from the sun. The absorption of this longwave radiant energy warms the atmosphere; the atmosphere also is warmed by transfer of sensible and latent heat from the surface. Greenhouse gases also emit longwave radiation both upward to space and downward to the surface of the earth; land & oceans. The downward part of this longwave radiation emitted by the atmosphere is the "greenhouse effect." The term is a misnomer, as this process is not the mechanism that warms greenhouses.
Global anthropogenic greenhouse gas emissions broken down into 8 different sectors for the year 2000
The major natural greenhouse gases are water vapor, which causes about 36-70% of the greenhouse effect on Earth (not including clouds); carbon dioxide, which causes 9-26%; methane, which causes 4-9%, and ozone, which causes 3-7%. It is not possible to state that a certain gas causes a certain percentage of the greenhouse effect, because the influences of the various gases are not additive. (The higher ends of the ranges quoted are for the gas alone; the lower ends, for the gas counting overlaps.) Other greenhouse gases include, but are not limited to, nitrous oxide, sulfur hexafluoride, hydrofluorocarbons, perfluorocarbons and chlorofluorocarbons.
The major atmospheric constituents (nitrogen, N2 and oxygen, O2) are not greenhouse gases. This is because homonuclear diatomic molecules such as N2 and O2 neither absorb nor emit infrared radiation, as there is no net change in the dipole moment of these molecules when they vibrate. Molecular vibrations occur at energies that are of the same magnitude as the energy of the photons on infrared light.
It is worth noting that late 19th century scientists experimentally discovered that N2 and O2 did not absorb infrared radiation (called, at that time, "dark radiation") and that CO2 and many other gases did absorb such radiation. It was recognized in the early 20th century that the known major greenhouse gases in the atmosphere did cause the earth's temperature to be higher than it would have been without the greenhouse gases.
Anthropogenic greenhouse gases
The concentrations of several greenhouse gases have increased over time. Human activity increases the greenhouse effect primarily through release of carbon dioxide, but human influences on other greenhouse gases can also be important. Some of the main sources of greenhouse gases due to human activity include:
- burning of fossil fuels and deforestation leading to higher carbon dioxide concentrations; - livestock and paddy rice farming, land use and wetland changes, pipeline losses, and covered vented landfill emissions leading to higher methane atmospheric concentrations. Many of the newer style fully vented septic systems that enhance and target the fermentation process also are major sources of atmospheric methane; - use of chlorofluorocarbons (CFCs) in refrigeration systems, and use of CFCs and halons in fire suppression systems and manufacturing processes. - agricultural activities, including the use of fertilizers, that lead to higher nitrous oxide concentrations.
Greenhouse gas emissions from industry, transportation and agriculture are very likely the main cause of recently observed global warming.
Carbon dioxide, methane, nitrous oxide and three groups of fluorinated gasses (sulfur hexafluoride, HFCs, and PFCs) are the major greenhouse gases and the subject of the Kyoto Protocol, which entered into force in 2005.
CFCs, although greenhouse gases, are regulated by the Montreal Protocol, which was motivated by CFCs' contribution to ozone depletion rather than by their contribution to global warming. Note that ozone depletion has only a minor role in greenhouse warming though the two processes often are confused in the popular media.
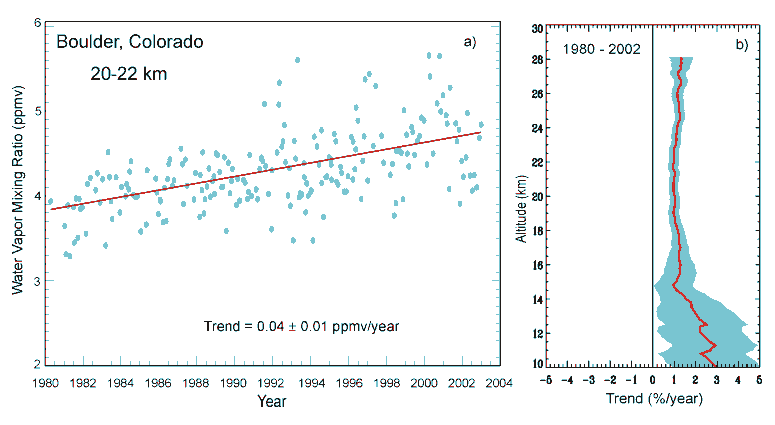
Increasing water vapor at Boulder, Colorado
The role of water vapor
Water vapor is a naturally occurring greenhouse gas and accounts for the largest percentage of the greenhouse effect, between 36% and 90%. Water vapor concentrations fluctuate regionally, but human activity does not directly affect water vapor concentrations except at local scales (for example, near irrigated fields).
In climate models an increase in atmospheric temperature caused by the greenhouse effect due to anthropogenic gases will in turn lead to an increase in the water vapor content of the troposphere, with approximately constant relative humidity. The increased water vapor in turn leads to an increase in the greenhouse effect and thus a further increase in temperature; the increase in temperature leads to still further increase in atmospheric water vapor; and the feedback cycle continues until equilibrium is reached. Thus water vapor acts as a positive feedback to the forcing provided by human-released greenhouse gases such as CO2. Changes in water vapor may also have indirect effects via cloud formation.
Intergovernmental Panel on Climate Change (IPCC) IPCC Third Assessment Report chapter lead author Michael Mann is quoted as saying, "It is extremely misleading, however, when scientists cite the role of water vapor as a greenhouse gas," because it can not be controlled by humans. The IPCC report has discussed water vapor feedback in more detail.
Increase of greenhouse gases
Measurements from Antarctic ice cores show that just before industrial emissions began, atmospheric CO2 levels were about 280 parts per million by volume (ppm; the units µL/L are occasionally used and are identical to parts per million by volume). From the same ice cores it appears that CO2 concentrations stayed between 260 and 280 ppm during the preceding 10,000 years. Studies using evidence from stomata of fossilized leaves suggest greater variability, with CO2 levels above 300 ppm during the period 7,000-10,000 years ago, though others have argued that these findings more likely reflect calibration/contamination problems rather than actual CO2 variability.
Since the beginning of the Industrial Revolution, the concentrations of many of the greenhouse gases have increased. The concentration of CO2 has increased by about 100 ppm (i.e., from 280 ppm to 380 ppm). The first 50 ppm increase took place in about 200 years, from the start of the Industrial Revolution to around 1973; the next 50 ppm increase took place in about 33 years, from 1973 to 2006. (96.8 KiB). Many observations are available on line in a variety of Atmospheric Chemistry Observational Databases. The greenhouse gases with the largest radiative forcing are:
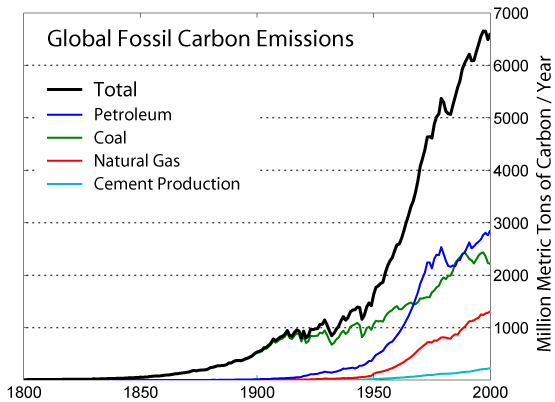
Global carbon dioxide emissions 1751–2000
Source: IPCC radiative forcing report 1994 updated (to 1998) by IPCC TAR table 6.1 [4][5]).
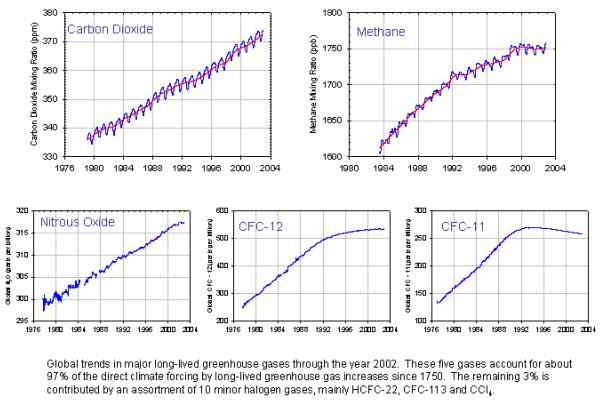
Global Major greenhouse gas trends 2003
Removal from the atmosphere and global warming potential
Aside from water vapor near the surface, which has a residence time of days, most greenhouse gases take a very long time to leave the atmosphere. Although it is not easy to know with precision how long, there are estimates of the duration of stay, i.e., the time which is necessary so that the gas disappears from the atmosphere, for the principal greenhouse gases. Greenhouse gases can be removed from the atmosphere by various processes:
- as a consequence of a physical change (condensation and precipitation remove water vapor from the atmosphere).
- as a consequence of chemical reactions within the atmosphere. This is the case for methane. It is oxidized by reaction with naturally occurring hydroxyl radical, OH· and degraded to CO2 and water vapor at the end of a chain of reactions (the contribution of the CO2 from the oxidation of methane is not included in the methane Global warming potential). This also includes solution and solid phase chemistry occurring in atmospheric aerosols.
- as a consequence of a physical interchange at the interface between the atmosphere and the other compartments of the planet. An example is the mixing of atmospheric gases into the oceans at the boundary layer.
- as a consequence of a chemical change at the interface between the atmosphere and the other compartments of the planet. This is the case for CO2, which is reduced by photosynthesis of plants, and which, after dissolving in the oceans, reacts to form carbonic acid and bicarbonate and carbonate ions.
- as a consequence of a photochemical change. Halocarbons are dissociated by UV light releasing Cl· and F· as free radicals in the stratosphere with harmful effects on ozone (halocarbons are generally too stable to disappear by chemical reaction in the atmosphere).
- as a consequence of dissociative ionization caused by high energy cosmic rays or lightning discharges, which break molecular bonds. For example, lightning forms N atoms from N2 which then react with O2 to form NO2.
Two scales can be used to describe the effect of different gases in the atmosphere. The first, the atmospheric lifetime, describes how long it takes to restore the system to equilibrium following a small increase in the concentration of the gas in the atmosphere. Individual molecules may interchange with other reservoirs such as soil, the oceans, and biological systems, but the mean lifetime refers to the decaying away of the excess. It is sometimes erroneously claimed that the atmospheric lifetime of CO2 is only a few years because that is the average time for any CO2 molecule to stay in the atmosphere before being removed by mixing into the ocean, uptake by photosynthesis, or other processes. This ignores the balancing fluxes of CO2 into the atmosphere from the other reservoirs. It is the net concentration changes of the various greenhouse gases by all sources and sinks that determines atmospheric lifetime, not just the removal processes.
The second scale is global warming potential (GWP). The GWP depends on both the efficiency of the molecule as a greenhouse gas and its atmospheric lifetime. GWP is measured relative to the same mass of CO2 and evaluated for a specific timescale. Thus, if a molecule has a high GWP on a short time scale (say 20 years) but has only a short lifetime, it will have a large GWP on a 20 year scale but a small one on a 100 year scale. Conversely, if a molecule has a longer atmospheric lifetime than CO2 its GWP will increase with time.
Examples of the atmospheric lifetime and GWP for several greenhouse gases include:
- CO2 has a variable atmospheric lifetime (approximately 200-450 years for small perturbations). Recent work indicates that recovery from a large input of atmospheric CO2 from burning fossil fuels will result in an effective lifetime of tens of thousands of years. Carbon dioxide is defined to have a GWP of 1 over all time periods.
- Methane has an atmospheric lifetime of 12 ± 3 years and a GWP of 62 over 20 years, 23 over 100 years and 7 over 500 years. The decrease in GWP associated with longer times is associated with the fact that the methane is degraded to water and CO2 by chemical reactions in the atmosphere.
- Nitrous oxide has an atmospheric lifetime of 120 years and a GWP of 296 over 100 years.
- CFC-12 has an atmospheric lifetime of 100 years and a GWP(100) of 10600.
- HCFC-22 has an atmospheric lifetime of 12.1 years and a GWP(100) of 1700.
- Tetrafluoromethane has an atmospheric lifetime of 50,000 years and a GWP(100) of 5700.
- Sulfur hexafluoride has an atmospheric lifetime of 3,200 years and a GWP(100) of 22000. Source : IPCC
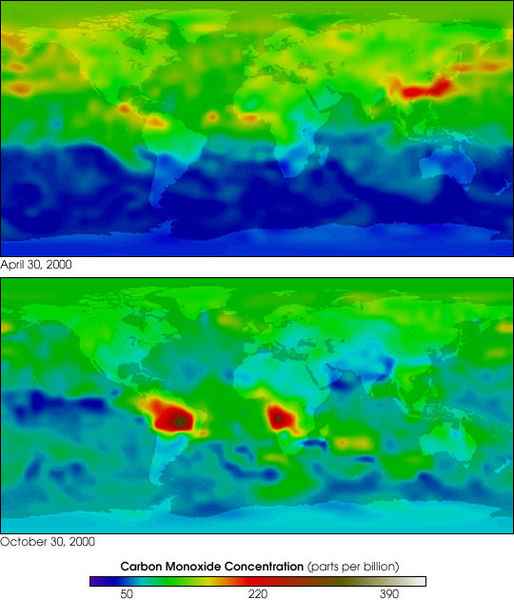
MOPITT 2000 global carbon monoxide
Related effects
Carbon monoxide has an indirect radiative effect by elevating concentrations of methane and tropospheric ozone through scavenging of atmospheric constituents (e.g., the hydroxyl radical, OH) that would otherwise destroy them. Carbon monoxide is created when carbon-containing fuels are burned incompletely. Through natural processes in the atmosphere, it is eventually oxidized to carbon dioxide. Carbon monoxide has an atmospheric lifetime of only a few months and as a consequence is spatially more variable than longer-lived gases.
Another potentially important indirect effect comes from methane, which in addition to its direct radiative impact also contributes to ozone formation. Shindell et al (2005) argue that the contribution to climate change from methane is at least double previous estimates as a result of this effect.
DESERTIFICATION COP HISTORY
CLIMATE CHANGE COP HISTORY
BIODIVERSITY COP HISTORY
LINKS and REFERENCE
Carbon dioxide emissions
Methane emissionsPolicy and advocacy
A taste for adventure capitalists
Solar Cola - a healthier alternative
|
||||||||||||||||||||||||||||||||||||||||||||||||||||||||||||||||||||||||
|
This website is Copyright © 1999 & 2019. The bird logos and name Solar Navigator are trademarks. All rights reserved. All other trademarks are hereby acknowledged. Max Energy Limited is an educational charity.
|